Project
Universe
I researched and designed a 27-slide astronomy talk in German, following Earth out into space and back through time.
Watch the motion preview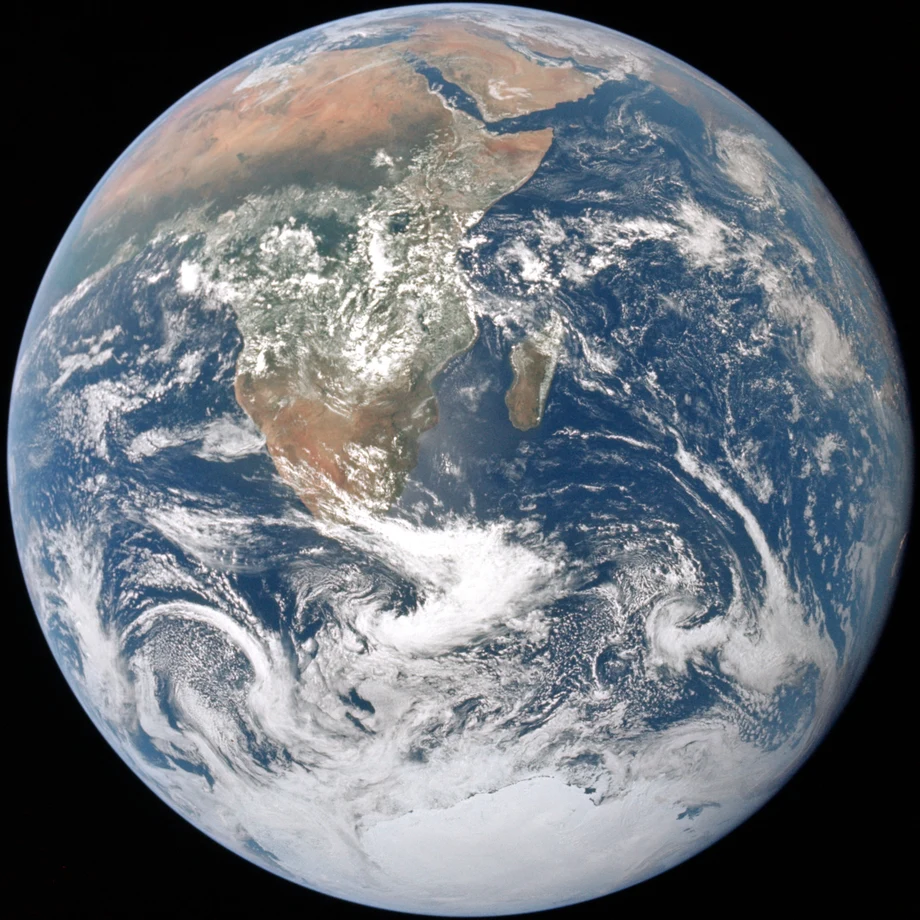
Following the Sun
One transition between slides 2 and 3.
Solar imagery by NASA’s Scientific Visualization Studio. Diagram and motion by Fabio Rusca.
The complete
sequence.
The live talk is designed for 15 minutes. This silent preview moves through all 27 slides in 1 minute 57 seconds.
Read the slides in English
- An Apollo 17 photograph shows Earth against black. The German word “Hier” means “Here.”
- Earth shrinks into a schematic line-up beside the Sun and the seven other planets.
- The same Sun expands into an ultraviolet close-up. Its diameter is about 109 times Earth’s.
- Four hydrogen nuclei become helium in a diagram of solar fusion. A small fraction of mass is released as energy.
- A full disc and a magnified detail show dark sunspots on the brighter visible surface.
- Mercury, Venus, Earth and Mars are compared by diameter, with Earth and Venus similar in size.
- The four giant planets change the scale of the diagram. Earth becomes a small point beside Jupiter.
- A wide Cassini image shows Saturn and its rings backlit by the Sun.
- A line running from the Sun to Neptune leaves most of the slide empty. A second strip separates the inner planets.
- A logarithmic ruler stretches past Neptune and the Kuiper Belt to the much more distant, proposed Oort Cloud.
- A line between Earth and the Sun shows the travel time of sunlight, about eight minutes and twenty seconds.
- A light-year becomes a distance in kilometres. The diagram extends to Proxima Centauri, about 4.24 light-years away.
- Three columns compare how far back we look when we see the Sun, Proxima Centauri and Andromeda.
- A Gaia-based reconstruction introduces the Milky Way. The disc is a reconstruction built from observations.
- A simplified overhead diagram locates the Sun within the galactic disc, away from its centre.
- A Hubble mosaic stretches Andromeda across the slide. Its light takes roughly 2.5 million years to reach us.
- An image of the Triangulum Galaxy accompanies distances to members of the Local Group.
- A simulation shows the cosmic web as bright concentrations connected by filaments around darker voids.
- The age of the universe is set beside the diameter of the observable universe. An expanding diagram separates time from distance.
- A timeline turns the journey back, moving from the present towards a hotter and denser early universe.
- A schematic disc around the young Sun shows the material from which the Solar System formed about 4.6 billion years ago.
- Chemical symbols trace elements to different origins, from early hydrogen to heavier elements made in stars and stellar events.
- A Webb deep-field exposure fills the slide alongside the era when the first stars and galaxies emerged.
- A Planck all-sky map shows small temperature variations in light released about 380,000 years after the early expansion began.
- A nuclear diagram shows light nuclei forming during the first minutes.
- Large words describe an early universe that was hot, dense and expanding. The timeline marks the limits of observation.
- The same Apollo 17 Earth returns to the screen. “Wieder hier” means “Back here.”
Image credits
- Earth, Apollo 17 ↗Earth Science and Remote Sensing Unit, NASA Johnson Space Center
- Sun and sunspots ↗NASA’s Scientific Visualization Studio
- Mercury ↗NASA / Johns Hopkins University Applied Physics Laboratory / Carnegie Institution of Washington
- Venus ↗NASA / JPL-Caltech
- Mars ↗NASA / JPL / USGS
- Saturn ↗NASA / JPL-Caltech / SSI
- Milky Way reconstruction ↗ESA / Gaia / DPAC, Stefan Payne-Wardenaar
- Andromeda ↗NASA, ESA, B. Williams (University of Washington)
- Triangulum ↗NASA, ESA, M. Durbin, J. Dalcanton and B. F. Williams (University of Washington)
- Cosmic web simulation ↗Andrew Pontzen and Fabio Governato
- Webb deep field ↗NASA, ESA, CSA and STScI
- Microwave background map ↗ESA and the Planck Collaboration